Hartford Steam Boiler
Elemental data visualized with sub-atomic particles.
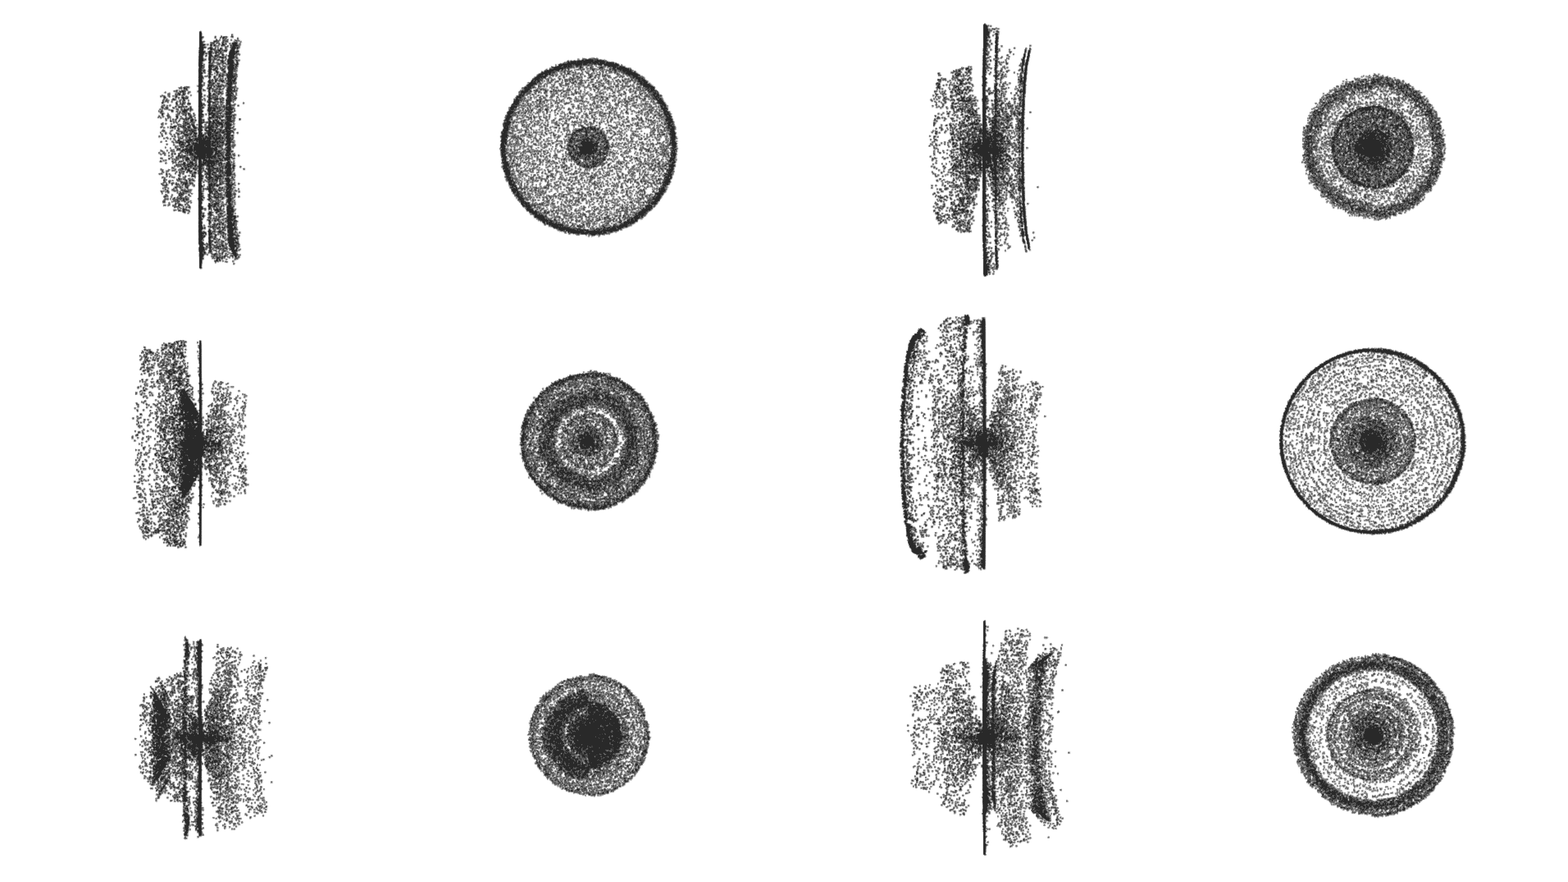
Thousands of sensors around the world collect hundreds of thousands of data points every day. These sensors are capturing the condition of the elements around them such as temperature, humidity, motion, water leaks, and electricity usage. Therefore, the medium chosen to visualize this data is at the core of the elements themselves: sub-atomic particles.
Data visualization dashboard
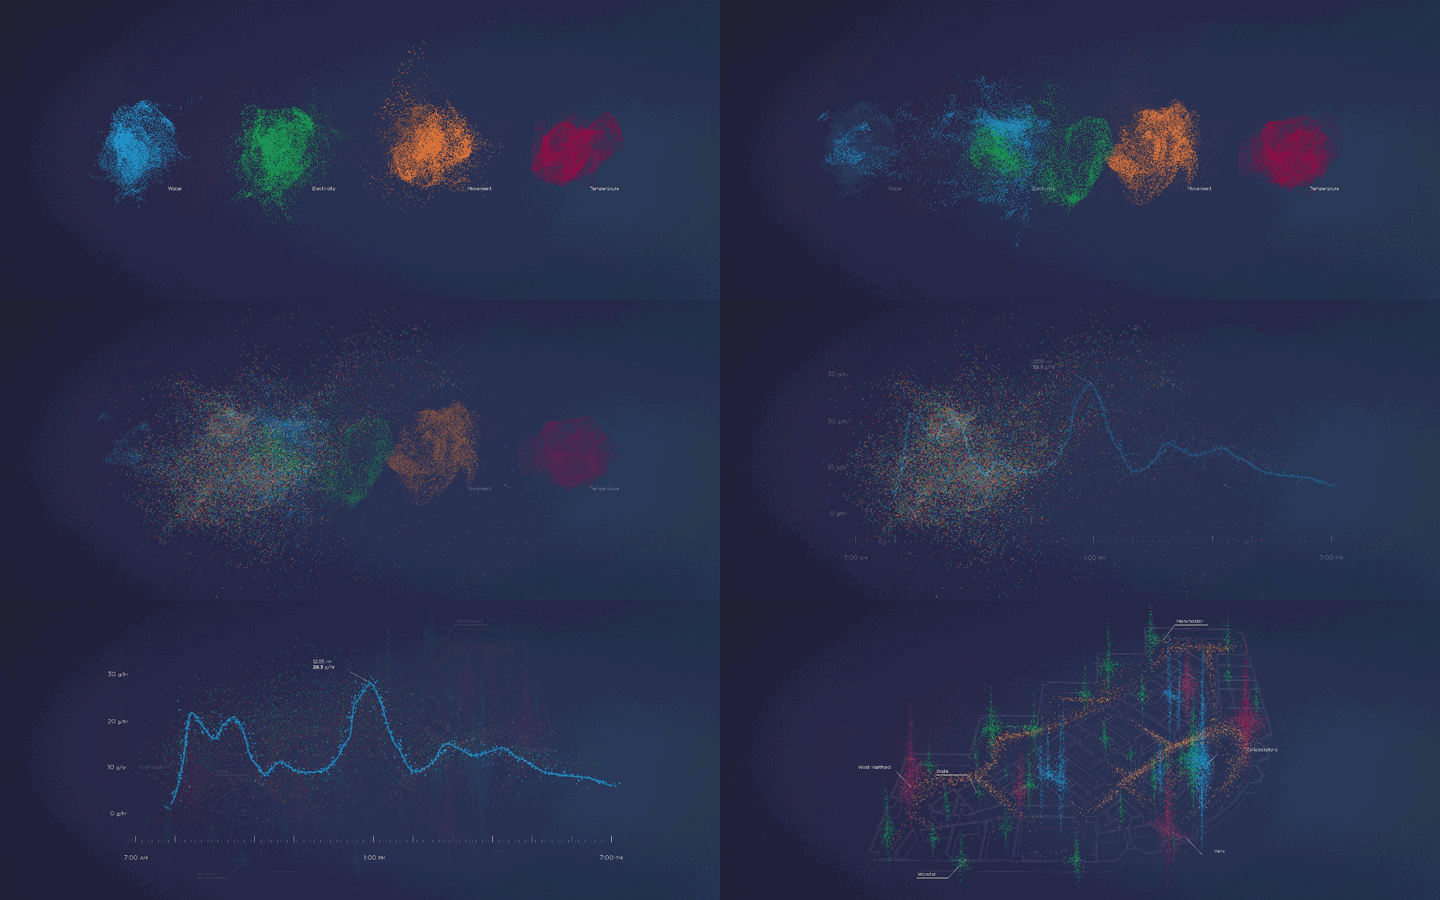
Color-coded electrons swarm throughout the dashboard representing thousands of readings from various sensor types. When a sensor type is selected, the electrons coalesce into the individual sensors plotted onto a map. Selecting a location pulls up a dashboard where the current readings can be analyzed in real-time. Filters may also be applied to solo out anomalies and sensor alerts.
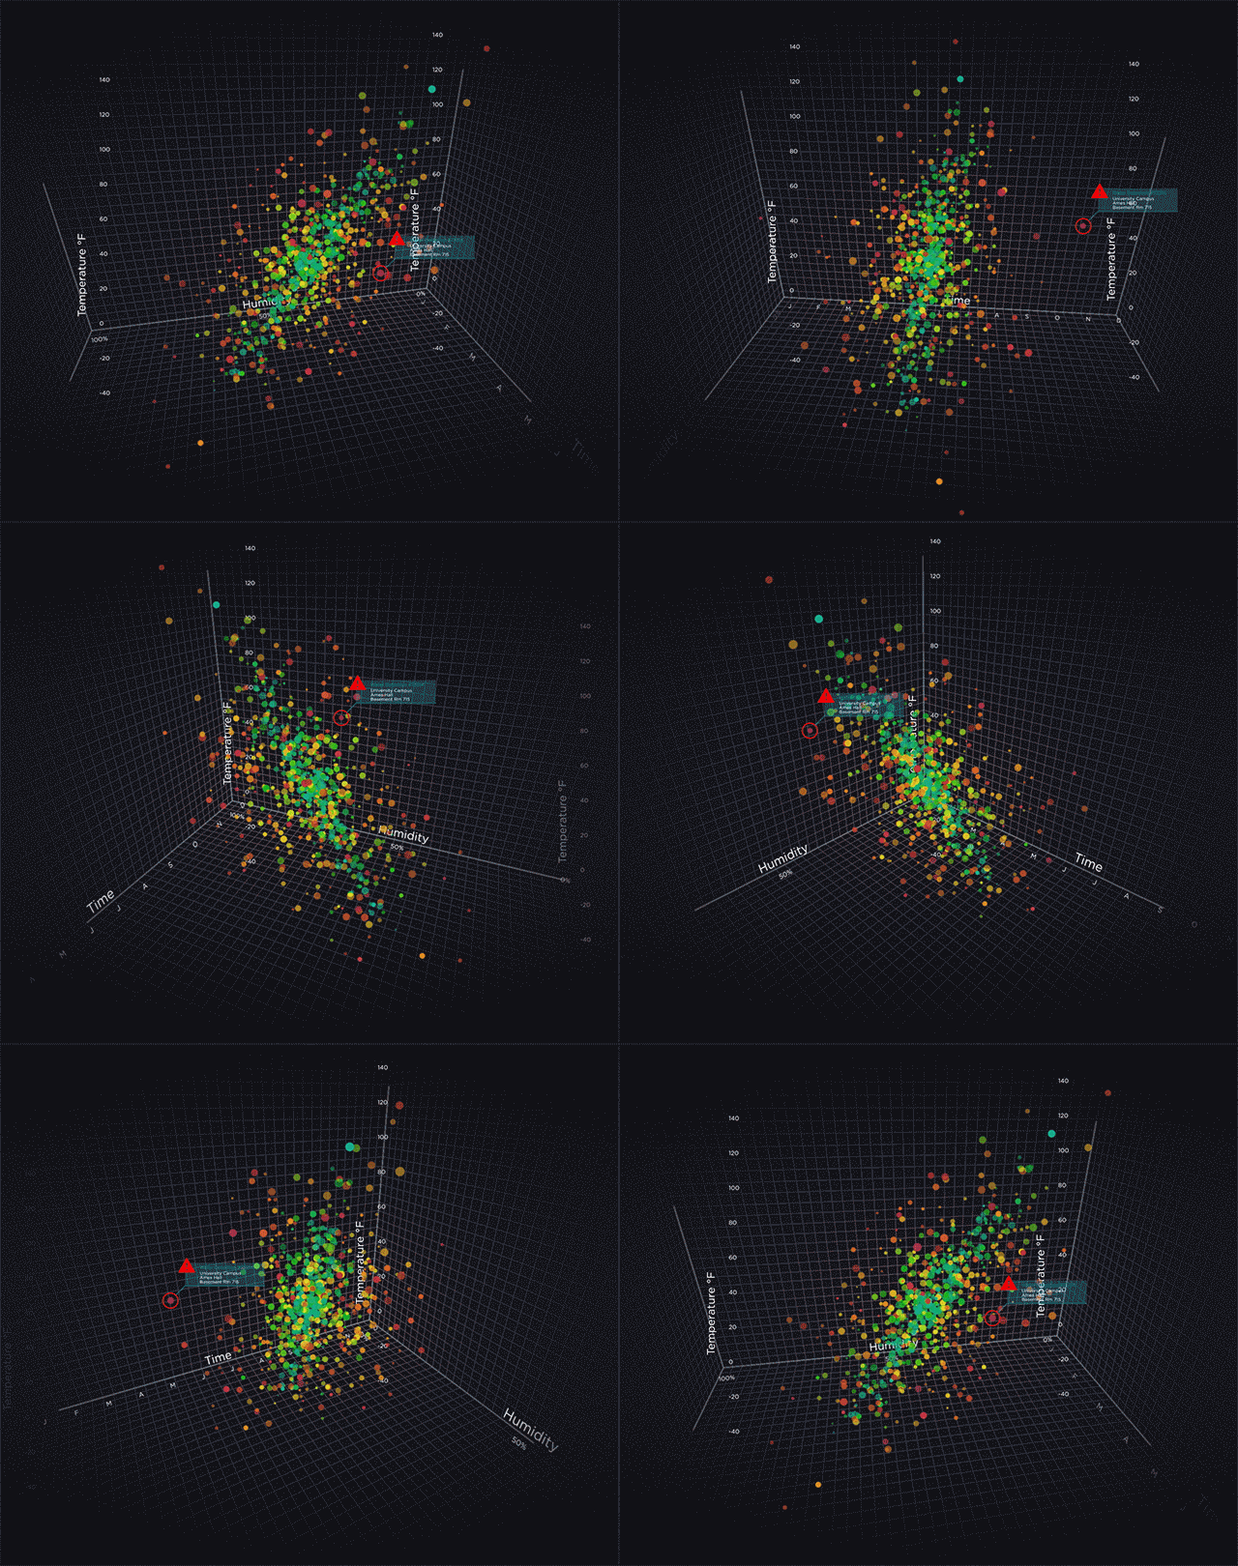
Concept work
Onsite monitoring
The dashboard aesthetics carried over to an interactive wall where sensor data can be monitored in a three dimensional site location.


